Tuesday, March 27, 2012

Jsunpack Patch for Detecting PDF JavaScript

1. Introduction
Jsunpack [1] is a great tool to examine the structure of a PDF and extract the embedded JavaScript inside a document. Specifically, the python script “pdf.py”, which is included in Jsunpack, handles the PDF document. The “pdf.py” script displays the objects contained within a given PDF, as well as, detects embedded JavaScript and outputs the JavaScript functions to a separate file for analysis. However; “pdf.py” may not always detect the embedded JavaScript. An example of a PDF document that bypasses detection is examined later.  An experimental approach is followed to figure out why jsunpack does not detect the embedded JavaScript. A solution is also presented to patch jsunpack.

2. JavaScript Detected
There are two versions of a PDF document that displays “Hello World” and pops up an alert box using JavaScript code. The first is the original version that was manually created in notepad and it displays the contents in plain text.

   
Figure 1.1 - Version 1 of the uncompressed pdf document labeled "works_original.pdf"

Notepad++ is used to view the contents of the original PDF document shown in Figure 1-1.We can see there are two objects with JavaScript tags; object 6 and object 8. Object 8 contains the actual JavaScript code to produce the alert box which displays, “This is my alert box”. We expect pdf.py to detect the JavaScript in object 6 and 8 and it does! Figure 1-2 shows a partial output of pdf.py executed with the original PDF as the input file.

Figure 1.2 - Output of pdf.py executed with version 1 of the pdf document (works_original.pdf) 

The original PDF document is labeled “works_original.pdf” since it is detected by pdf.py as containing JavaScript.

3. Javascript Not Detected
The second document is a compressed version of the “works_original.pdf” file. The second version uses FlateDecode to compress the streams. When the “works_original.pdf” is saved in Adobe Acrobat Professional 9, the application automatically compresses and converts the original version to the compressed version. Pdf.py can be used to examine the contents. We can see that the structure of the PDF has been modified. New objects are created in the document that did not exist in the “works_original.pdf”. The compressed version is labeled “notwork.pdf” since the JavaScript is not detected by pdf.py. Figure 1.3 is the output from pdf.py with the compressed version (notwork.pdf) as the input.

Figure 1.3 - Output of pdf.py executed with version 2 of the pdf document (notwork.pdf)

A couple of interesting results can be seen from the figure above. First and most importantly, no JavaScript is detected in the compressed file. Second, all the objects are not displayed and references are included to objects that do not appear in the output. For example, object 8 has a tag “/Names” which refers to an object 13 that is not visible. To get a better idea of what is going on and what is contained in the compressed streams, the tool pdfstreamdumper [2] is used. This tool decompresses all the streams that have been encoded with filters like “FlateDecode” and presents the text in a graphical user interface.

Figure 1.4 - Objects listed by Pdfstreamdumper for the notwork.pdf 

Pdfstreamdumper provides a list of objects contained in the PDF and is displayed in Figure 1.4. The list is consistent with the output that “pdf.py” returns so where are the missing objects? If we examine each object and its contents we discover the missing objects are contained within other objects. For example, object 10 contains object 13, 14, 15 and 16.

Figure 1.5 - Contents of object 10 shown by Pdfstreamdumper for the notwork.pdf

To understand the syntax we can refer to PDF Document Reference [3], however, it is clear after some simple analysis. As we can see from Figure 1.5 we have four objects listed consecutively. The first number is the object number and the second is the offset to the beginning of the next stream. So the first two numbers “13 0” declares the object 13 is contained first at offset 0. The next two numbers “14 22” is object 14 and the content for that object is at offset 22. The same for the next two pairs “15 49” and “16 146”. If we look back at the output of pdf.py we see the tags for object 10 and which tag allows for multiple objects.

Figure 1.6 - Snippet from the output of pdf.py for notwork.pdf

We see that the tag “/ObjStm” allows for multiple objects to be embedded into object 10 and we can confirm by looking at the PDF Document Reference [3]. Also the tag “/N” informs us of how many objects are included inside object 10 and as we can see in Figure 1.6, and is verified by pdfstreamdumper, the number of objects inside object 10 is 4. The same process above can be followed to determine where the missing objects 5 and 6, from the pdf.py output, are located. Object 5 is embedded in Object 2. Object 6 is embedded into object 3. Figure 1.7 and Figure 1.8 show the contents of objects 2 and 6 respectively using pdfstreamdumper.

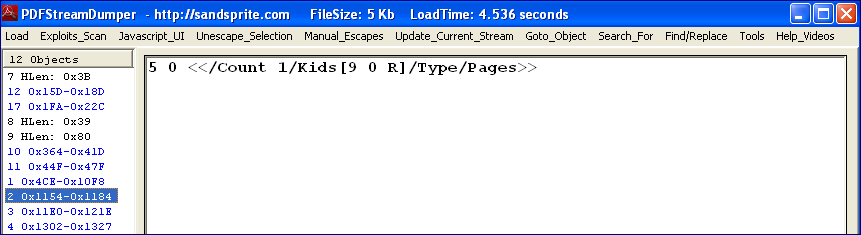
Figure 1.7 - Contents of object 2 shown in Pdfstreamdumper for the file notwork.pdf

Figure 1.8 - Contents of object 3 shown in Pdfstreamdumper for the file notwork.pdf

The locations of the missing objects are known and this information can be used to figure out why the pdf.py script does not detect the JavaScript in the “notwork.pdf” document. The python debugger is utilized to step through the “pdf.py” functions and determine how each object is parsed, specifically object 10. This article assumes the reader knows how to use the python debugger and does not go into detail on the debugging process.

4. Results and Solution
The results of the debugging session are the following. The python script “pdf.py” does not handle the “ObjStm” tag. Any object with a tag “/ObjStm” has a stream that is decompressed, if necessary, however, the information in the stream is not parsed by “pdf.py”. So what we can do here is inject code into pdf.py to handle the “/ObjStm” tag. Figure 1.9 is the code I wrote that detects if an object has a “/ObjStm” tag. Also it checks each object inside and determines if there exist JavaScript.

Figure 1.9 - Code created for pdf.py to address objects streams in a PDF document

This code has also been submitted to Jsunpack’s source code and the patch request is pending review. Figure 1.9 displays the new output for “notwork.pdf” when executed with the modified “pdf.py” script which includes the code shown above.

Figure 1.10 - Output of modified pdf.py executed with the file notwork.pdf

As we can see in Figure 1.10 the python script detects the JavaScript! The objects 13-16 and 5-6 were missing from the unmodified version. Our modification makes those objects visible in the output as well as outputs the JavaScript functions to a separate file. In the example above the JavaScript is exported to a file named “notwork.pdf.out”. Overall this solution improves upon the pdf.py script and allows it to handle objects in an object stream. More importantly it detects if JavaScript exist inside an object stream.

5. Additional Patch to Pdf.py 
Another patch that has been made to the pdf.py script is in regards to the “/Names” tag. I noticed that if the “/Names” tag includes a custom name with the tag then the parsing only captures the text of the name and not the reference number. An example is shown below.

Figure 1.11 - Snippet of the output from pdf.py for the file notwork.pdf

For object 14 there is a “/Name” tag and the output only display the text “My Code” which is the name given to the reference to object 15. However, the reference to object 15 does not appear. After utilizing the python debugger to trace into the program, the issue is due to the parenthesis which stops the parsing function from capturing anything after the parenthesis. This is easily fixed by adding a condition to an existing “if” statement in “pdf.py”. The change is displayed in Figure 1.12.

Figure 1.12 - Code created for pdf.py to address the missing reference number for the tag "/Names" 

The tag variable is an array that contains the stream for the current object. So as well as looking for the condition “\\”, I added the condition “curtag == ‘Names’ “. This line now checks if the current tag is a “/Name” tag and if it is the parsing function will continue to collect the following characters in the tag which would include the object reference number.

Figure 1.13 - Snippet of output from the modified pdf.py for the file notwork.pdf

Figure 1.13 shows the new output of the modified “pdf.py” script which includes the reference as well as the text name which is given to the tag “/Names”.

6. References
[1] Jsunpack, Available at http://code.google.com/p/jsunpack-n/
[2] Pdfstreamdumper, Available at http://sandsprite.com/blogs/index.php?uid=7&pid=57
[3] Pdf Document Reference, Available at http://www.adobe.com/devnet/pdf/pdf_reference.html

Tuesday, March 20, 2012

ZeroAccess Rootkit - Part 2

1. Debuggers
Debugging an application means to detect and remove bugs from an application. Debuggers are essential in software programming because they can help quickly identify a syntactic or logic error in a program.  In the field of malware analysis, debuggers are used to study how malicious codes work in order to provide a method of detection and removal. Debuggers are also used by software pirates who reverse engineer popular software to find ways to remove protections put in place by the application developers.  Due to the emergence of software pirates and their utilization of debuggers, developers use anti-debugging techniques to serve as a deterrence to those individuals who reverse engineer their code. There is no complete solution to stop a reverse engineer who is committed, however, anti-debugging techniques makes the process more difficult, requires a higher level of expertise to bypass, and increases the time for analysis of an application [2].Similar to application developers, who utilize anti-debugging techniques to serve as a layer of protection for their software, malware authors also adopt these techniques for the malware they create. In this scenario debugging techniques serve as a deterrence to malware analysts. The purpose is to prevent accurate analysis of the malicious code by the malware analysts and in effect increase the lifespan of the malware.

2. Dynamic Behavior of Int2d
Many anti-debugging techniques exist; however, this section concentrates on the Int2d instruction since it is frequently used in the Max++ rootkit. The int2d interrupt is a special interrupt reserved for Microsoft kernel debugging service. It raises an exception to be handled by the kernel debugger. If the kernel debugger does not handle the exception it is then passed to the user level exception handling. When an interrupt 2d is executed, the memory address of the exception points to the EIP register. The EIP register is the instruction pointer and always points to the next instruction. After the exception address has been set to the EIP register, the EIP is incremented by one byte.  An exception breakpoint is issued and the exception is either handled or not handled by an exception handler. When no debugger is attached to the system, execution will resume at the address of the exception. The execution will resume normally because the exception is assumed to be corrected and the process can continue from the exception address. If a debugger is present, the execution of the program will continue at the EIP address which is one byte after the exception address. The program skips one byte and this is known as a byte scission.

Due to the difference in observed behavior of the int2d instruction, this can be used to determine if a debugger is present on the system. Also since one byte is skipped, this instruction can be used to change the execution of programs based on the debugging environment. A program may run differently if a debugger is attached to the system as opposed to if no debugger is attached. This technique proves problematic for malware analysis.

This section also explores the dynamic nature of the int2d instruction. The complexities of int2d are more than meets the eye and the factors that change its behavior are numerous. Some examples of factors that can change the observed behavior of the int2d instruction are the values of the register, the structured exception handling, whether a user level debugger is present, as well as whether a kernel level debugger is attached. Different behaviors can be observed by combinations of the above examples. An experimental approach is followed to examine the change in behavior exhibited by int2d.

3. Int2d Experiment Design
To analyze the int2d instruction, the C program in Figure 2.2 is utilized. Written by Dr. Xiang Fu [1], the Int2dExp.cc program is used in this paper to perform experiments with the int2d instruction. The file is compiled into a binary executable to later debug. The program consists of two print statements. The first print statement displays the characters “AAAA”. The second print statement displays the characters “BBBB”. Variables are also included in the code to give room to insert assembly instructions in a debugger. Immunity debugger allows us to debug the executable and modify the assembly instructions.

Figure 2.2 – C code for Int2dExp.cc

Figure 2.3 shows the int2dexp binary file opened in Immunity debugger. The important section of the assembly instructions are shown below. From the memory address “004010DA” to “004010EF, the variables “a” through “d” are initialized. The next two lines stores the value “AAAA” and display it by calling the “printf” function from the “cygwin.dll” file at address “004010FD”. The second print statement is located at address “00401125” and displays the characters “BBBB”.

Figure 2.3 – Assembly instructions shown in Immunity debugger for int2dexp executable

The instructions are modified to incorporate the use of the int2d instruction. In order to test the different behaviors we set up an int2d instruction and overwrite the previous initialization of variables. The int2d is followed by a one byte instruction which is “INC”. To test if the byte after int2d is skipped we include a “CMP” and “JE” instruction. “CMP” compares two values and sets the Z flag in the debugger. The instruction compare subtracts the two values from each other and if they are equal then the result is zero. When the result is zero the “Z flag”, which stands for “zero flag”, will be set to one. If the two values in the compare instruction are not equal the z flag is set to zero. The “JE” instruction stand for “jump if equal to zero” and it depends on the “z flag”. If the two values in the compare function are equal, then the z flag is set to 1 and the “JE” is true and results in a jump to the address specified. The “JE” instruction allows us to see if int2d causes a byte scission. Figure 2.4 shows the modified int2dexp with the EAX register set to one. If a byte is skipped then the “INC EAX” instruction will not be executed. The EAX register retains the same value and at the instruction “CMP” the two values remain equal. The jump instruction is true and the execution would jump from the address “0040110D” to “0040112A”. The jump address is right after the second print statement and prevents the characters “BBBB” from being displayed. Figure 2.4 only displays the character “AAAA”.

Figure 2.4 - Assembly instructions in Immunity debugger for int2dexp where EAX equals one and the JE is included

Another way to accomplish the same experiment above is to replace the instruction “JE” with the instruction “JNZ”. “JNZ” stand for jump if not equal to zero and does the exact opposite of the “JE” instruction. If two values in the compare function are not equal to each other than the JNZ instruction will jump to a specified address. For the same example above if we replace JE with JNZ the program would display “AAAABBBB” instead of only “AAAA”. “JNZ” example can be seen in Figure 2.5.

Figure 2.5 – Assembly instructions in Immunity debugger for int2dexp where EAX equals one and JNZ is included

The program above allows us to test the int2d behavior against two factors. First the debugging environment is changed. The execution is examined with a user level debugger attached, a kernel level debugger attached, and with no debugger attached. The second factor that is changed is the value of the EAX register. The EAX register can be easily modified by changing the value at address “00401102”. Figure 2.6 shows an example where the EAX register is changed to the value two.

Figure 2.6 - Assembly instructions in Immunity debugger for int2dexp where EAX equals two and JE is included

4. Int2d Experiment Configuration
A virtual box image of Windows XP SP2 was used as a host system. The guest system was Windows 7 Home Edition with debugger tools installed on both systems. Below is the serial port configuration for the host system.

Figure 2.7 – Serial port configuration for the windows host system

Figure 2.7 displays the command issued to start a windbg session through the windows SDK command prompt. The port must match the virtual box serial configuration shown above.

Figure 2.8 – Windows SDK 7.1 Command prompt and command to connect to host system

A successful connection to the host machine presents the following window shown below in Figure 2.6. Windbg executes an interrupt “int 3” on the machine by default when first connected and the command “g”, which stands for go, resumes the execution of the host system.

Figure 2.9 – A successful connection established in WinDbg

This command is also used to continue execution of the host machine when an exception has been raised and the host system waits for the exception to be handled. This command is used in the following experiments.

5. Int2d Experiment Results
Figure 2.8 presents results for the experiments with the int2d instruction. The values 1, 2, 3, 4, and 99 are used for the register EAX. Also the int2dprint program executes in different debugging environments and the different combinations are listed below.

Figure 2.10 -  Results for executing int2dexp.exe in various debugging environments and with different values for the
                        EAX register

One particular area of interest is the row where the EAX register value is one and the different debugging environments are tested. Red text indicates that the “INC” instruction executed and the int2d did not cause a byte to be skipped. This behavior is observed only when a kernel debugger is attached to the system, in this case windbg. When windbg is not attached to the system and the EAX register value is one, the int2d interrupt does cause a byte to be skipped. This is significant due to the fact different behaviors are observed and can be used to determine when a debugger is attached and when it is not attached.

From the figure above we can see there is a way to precisely identify if the system is set up in one of four configurations. One configuration is a kernel debugger and a user level debugger attached to a system. The second configuration is a kernel debugger and no user level debugger attached. The third configuration is no kernel debugger and a user level debugger attached. The last configuration is no kernel debugger and no user level debugger attached. Each of the configurations can be identify by their unique behavior.

The configuration of no kernel debugger and no user level debugger can be identified when EAX is equal to zero. Figure 2.10 shows that only in this set up, where the EAX is equal to zero, the “int2dprint” program displays no characters in the command window.

The configuration of no kernel debugger and immunity debugger can be identified when the EAX is equal to two. When the EAX is equal to two, this is the only set up where the output of “int2dprint”is “AAAA” for the “JZ0” command and “AAAABBBB” for the “JNZ” command. Two other configurations also print the same statements, however, only after the WinDbg breakpoint is resumed by the guest system.

The third configuration of kernel debugger and no user level debugger attached can be identified when the EAX register is equal to zero. Only in this set up the “INC EAX” is executed and the resulting display is “AAAABBBB” for the “JZ0” command and “AAAA” for the “JNZ” command.

The last configuration of kernel debugger and user level debugger can also be identified but in two steps. When EAX is equal to zero, there is one configuration that shares the same result where there is a kernel debugger and user level debugger attached to the system. The second configuration that shares the same result for the “int2dprint” is where there is no kernel debugger and a user level debugger is attached. For both of these set ups the result of the program is “AAAA” for the “JZ0” command and “AAAABBBB” for the “JNZ” command. The configuration of kernel debugger and user level debugger attached can be determined by checking the EAX value of two after the EAX value of zero. If the output is not “AAAA” for “JZ0” when the EAX value is equal to two, then the configuration we have is a kernel debugger and user level debugger attached. Alternately, process of elimination can be used since three of the four configurations can be identified.

Here lies the reason the int2d instruction serves as an anti-debugging technique. A program with an int2d interrupt can cause a program to execute differently with a debugger attached as opposed to without a debugger. As shown above with Immunity debugger, when EAX equals one, “AAAABBBB” printed with a debugger was attached. “AAAA” printed with no debugger was attached. Malware authors use this interrupt to prevent accurate analysis of their malware.

An important note to make is that int2d can be used to crash a system. As shown in Figure 2.10, when the EAX register is equal to zero, and the computer is in debug mode, and immunity debugger is not attached, if the int2d instruction is used then the system will freeze and require a manual reboot. Also a system can be crashed with immunity debugger attached. If the EAX register is changed to two and the int2d is executed, again the system freezes and requires a manual reboot.

6. References
[1] Dr. Xiang Fu, Malware Analysis Tutorial 4: Int2dh Anti-Debugging, Available at    
     http://fumalwareanalysis.blogspot.com/2011_10_01_archive.html

Friday, March 2, 2012

Decode PDF and Extract Javascript

1. Introduction
In the previous articles we looked at how to manually create a PDF and how to embed JavaScript inside the PDF document. I will now continue to look at how to extract JavaScript and decompress a PDF in order to reverse engineer the code inside. When a PDF is created or saved, the streams inside the PDF are commonly compressed and encoded with filters such as “FlateDecode”. The stream objects in a PDF are the objects which contain the JavaScript or text which we wish to read. Many times malware authors embed their malicious code inside these JavaScript streams and it is beneficial for security professionals to extract and decompress these streams. Let us revisit the PDF example presented in the previous article How to Embed JavaScript into PDF. Since the PDF was manually created, the streams are in plaintext, however, we will use Adobe Acrobat 9 to save the file again and this time the streams are encoded and not readable in a file editor.


Above is a partial view of the PDF we created in the previous article with the streams encoded. As you can see the PDF has been modified. More objects have automatically been added and the original streams with JavaScript are not readable. Also the first header line which tells me the PDF specification this document follows has been changed as well. Originally it was “%PDF-1.6”, now it is “%PDF-1.6”. This is due to the version of Acrobat I used which is Acrobat Pro 9. Other changes can also be found such as metadata that is now included in the document.


The streams may be compressed with several different filters, most commonly the FlateDecode filter is used to encode a PDF. After inspection of the document we can see that the PDF has been encoded using the filter FlateDecode. There are two tools we can use this decode the PDF. The first tool is “pdftk” available for download at http://www.pdflabs.com/tools/pdftk-the-pdf-toolkit/. This program runs on Windows, Linux, Mac OS X, FreeBSD and Solaris. It has many features which allow us to manipulate a PDF, among them is the ability to decompress streams and read the file in plain text. The second tool is “Jsunpack-n”. It is a powerful tool to decode and extract JavaScript from a PDF file.

2. PDF Toolkit
PDF toolkit is easy to install. Download the zip file from their website and place it in a convenient location. Then add the location of the bin folder to your environment variables. This can be done by accessing the properties of your computer and clicking on the advanced tab.


Click on “Environment Variables” and here we locate the "Path" variable and add the location of our bin folder for pdftk. This allows us to use pdftk from the command prompt without having to navigate to the program folder each time.


Below is the command used to decompress the PDF file. First is the call to the program pdftk. Second we list the location of the PDF we wish to decompress. Third is the parameter output. Here we list the new filename we wish to use for our decompressed file. Last we specify the parameter “uncompress” which will decode the streams in the PDF file. To view all the commands in pdftk and the accompanying examples, type the command “pdftk –help”.


The decoded file is created and below is the file opened in the file editor notepad++. Selected parts of the code are shown below with the corresponding line number to the left.


First we can see that the streams are in plain text. We can identify the object 9 which contains the JavaScript for our alert box. Something to notice is that for the xref section of the file we had previously left this part blank with only the object name. After it was encoded and decoded the offsets were automatically calculated for all the objects.

3. Jsunpack
The second tool we can utilize to decode and extract the JavaScript in a PDF file is Jsunpack. I tested it on Ubuntu 10.04 and the latest version can be obtained by running the following code in Ubuntu

               $ svn checkout http://jsunpack-n.googlecode.com/svn/trunk/ jsunpack-n

Follow the instructions in the INSTALL file to complete the installation. After installed we can use the terminal to examine a PDF file. I tested it on my previous sample PDF file and the file was decoded however no JavaScript was decoded. Therefore I tested it on a sample JavaScript clock file which served as a better example. The JavaScriptClock file is available at http://www.PDFscripting.com/public/47.cfm. Open the file in a file editor and it is visible that the streams are encoded.

Below is the command to call the PDF python script. You provide the location of the PDF file and the python script handles the rest. For more verbose information on the file attach a “-v” to the end of the command. The command below decodes the file and extracts the JavaScript embedded in the PDF to a separate file that we can examine. Jsunpack appends “.out” to the new file created.


“JavaScriptClock.PDF.out” contains the JavaScript and below is a partial output in gedit. We can see all the functions and declarations that were made using JavaScript. This provides a useful way to look at obfuscated PDF that may contain malicious code.


4. Conclusion
To conclude, there are tools that exist to make it easier to manipulate and decode PDF documents. Above I have shown two tools, pdftk and Jsunpack, that are useful to decode streams in a PDF. The streams will usually contain JavaScript and unfortunately malware authors will embed JavaScript that will perform undesired functions in another user’s computer. These tools allow us to reverse engineer the code and discover if malicious code is embedded. As shown above Jsunpack also provides the user with all the JavaScript in a separate file which is useful for analysis. In the next article I will explore buffer overflow attacks and vulnerabilities of PDFs and previous versions of adobe acrobat.

References
[1] "Document Management - Portable Document Format", Available at
       http://www.adobe.com/devnet/pdf/pdf_reference.html
[2]  Michael Leigh, "Malware Analyst's Cookbook and DVD", Available at
       http://www.amazon.com/Malware-Analysts-Cookbook-DVD-Techniques/dp/0470613033